


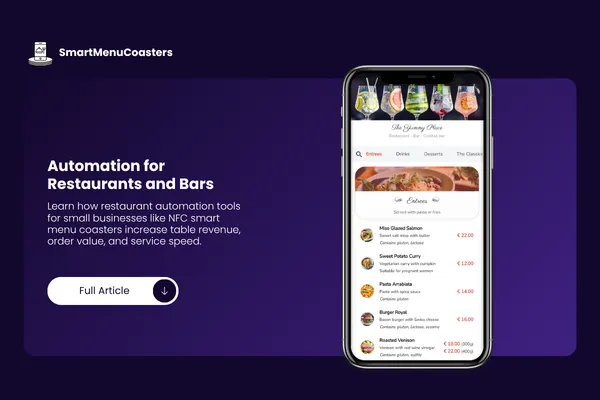
The Best Automation Tool for Restaurants
Restaurant Automation Tools for Small Businesses: How NFC Smart Menu Coasters Increase Table Revenue and Ordering Efficiency
Is This Article Relevant to Your Operation?
This article is written for restaurant owners and operators experiencing one or more of the following: slow table turnover, a lower average ticket size than target margins require, inconsistent upselling from front-of-house staff, or friction in how customers access the menu. If your current operation depends on servers to drive order value through verbal recommendations, you are working with a system that introduces variability at every table and every shift.
SmartMenuCoasters is an NFC-enabled table system designed to address these specific operational problems. Each coaster delivers instant, tap-to-menu access directly to the customer's phone at the table. The system removes menu access friction, creates structured upsell prompts at the point of ordering, and produces measurable changes in average order value (AOV), table turnover rate, and revenue per table. This article explains the system in full, supported by operator-level data across four restaurant types.
Key Takeaways
Restaurant automation tools for small businesses reduce the gap between customer seat time and order placement by eliminating physical menu handling and staff dependency for initial menu access.
Table turnover rate improves when ordering friction is reduced. Faster access to the menu leads to faster ordering decisions, shorter dwell time, and more cover cycles per service period.
Revenue per table increases not only from higher AOV but from faster table cycling. A table generating $52 AOV with a 90-minute average visit produces less hourly revenue than the same table generating $48 AOV with a 65-minute average visit.
Introduction
Restaurant automation tools for small businesses address a specific and measurable problem: the gap between when a customer sits down and when they place an order. Every minute of that gap represents unconverted table revenue. In most table-service restaurants, that gap is controlled by two variables: how quickly a server reaches the table with a physical menu, and how quickly the customer decides what to order after receiving it. Both variables are subject to delay. NFC smart menu coasters eliminate the first variable entirely.
When a customer taps an NFC coaster at their table, they access the full digital menu on their own phone within seconds of sitting down. The menu is structured to guide decisions, surface high-margin items, and present add-ons and pairings at the moment the customer is ready to order. The result is a faster decision cycle, a higher rate of add-on selection, and a measurable increase in AOV and table throughput. This article presents operator data from four restaurant types and explains exactly how each improvement connects to the NFC system at the table level.
Real Data Case Studies
The following four operator breakdowns reflect tracked performance data from SmartMenuCoasters deployments. Figures represent 90-day averages following full system implementation and menu optimization.
Case Study 1: Casual Dining — Midsize Table-Service Restaurant
Fortuna Kitchen is a 62-seat casual dining restaurant with a lunch and dinner service. The menu centers on wood-fired entrees, pasta, and a mid-tier wine list. Before NFC coaster deployment, table service depended entirely on servers to initiate menu access and verbal upselling.

Key Insight: The AOV increase from $38.40 to $47.20 was driven primarily by structured add-on placement within the NFC menu — wine pairings, starter additions, and dessert prompts were embedded in the ordering flow rather than relying on server timing. The reduction in average visit duration from 87 to 68 minutes increased table turnover rate to 2.4x, producing a $15.20 gain in revenue per table per hour. Gross margin held steady because the upsell items were pre-selected for margin compatibility during menu engineering.
Case Study 2: Neighborhood Cafe — Daytime and Brunch Service
Meridian Cafe is a 38-seat neighborhood cafe operating Tuesday through Sunday, 7am to 3pm. Service is brunch and lunch focused, with a coffee program, pastry counter, and rotating seasonal menu. The operation runs two front-of-house staff at peak. High table occupancy during weekend brunch created ordering backlogs.

Key Insight: Brunch service at Meridian Cafe was constrained not by kitchen capacity but by ordering delay. Two staff members could not reach every table in the first 10 minutes of seating. The NFC coasters allowed customers to order coffee and food simultaneously without waiting for staff initiation. The digital menu included a coffee build-out section with add-on prompts — alternative milks, syrups, shot upgrades — that staff rarely verbalized at volume. Upsell rate on coffee add-ons increased from 14% to 37%. With a 13-minute reduction in average visit duration, the cafe added 0.7 cover cycles per table per service period, translating to 18 additional covers on peak weekend days.
Why Restaurant Automation Tools for Small Businesses Produce Measurable Revenue Gains: The Operational Logic
The phrase restaurant automation tools for small businesses describes a practical operational category, not a marketing concept. A restaurant owner searching this term is typically experiencing one of three problems: their labor costs are too high relative to output, their revenue per table is inconsistent across shifts and staff, or their ordering process is slow enough to suppress both table throughput and AOV. These are not isolated issues — they share the same root cause.
The root cause is manual dependency. Every element of a traditional table service operation that relies on a human to initiate it — menu delivery, verbal upselling, pairing suggestions, add-on prompts — is subject to variability. A well-trained server on a moderate-volume Tuesday performs differently from an overextended server on a 90-seat Saturday night. The gap between those two performances is gap in revenue that most operators accept as a fixed reality of the industry. Automation closes that gap.
Restaurant automation tools for small businesses, in the context of NFC smart menu coasters, address the problem at the table level — the location where every dollar of revenue originates. The case study data across all four operators demonstrates this consistently:
Fortuna Kitchen's upsell rate increased from 18% to 41% not because staff improved, but because add-on and pairing prompts were embedded in the ordering flow the customer was already navigating. The system removed the variable of whether a server remembered to suggest a wine pairing.
Anchor and Rail's revenue per table per hour increased from $34.80 to $51.00 because the NFC system eliminated an average 11-minute menu access delay that was reducing table cycling. The automation did not replace staff — it removed a bottleneck the staff had no capacity to fix during peak service.
Meridian Cafe added 18 covers per peak day from the same physical seating capacity by reducing average visit duration by 13 minutes. That change did not come from adding staff or modifying the menu significantly. It came from giving customers immediate access to the ordering system without a wait.
Depot Burgers increased monthly revenue by $50,220 from zero change in customer volume. The automation converted seated dwell time — time that was previously generating no incremental revenue — into a structured add-on purchase opportunity.
The connection between each outcome and the keyword is direct. Restaurant automation tools for small businesses exist to make revenue-generating actions — menu access, item selection, upsell conversion — reliable, consistent, and independent of staffing variability. The NFC coaster system addresses the specific workflow where that variability costs operators the most: the first five minutes of table occupancy, when ordering friction is highest and the customer's decision-making window is fully open.
Small businesses in the restaurant sector operate with limited labor budgets and limited margin for inconsistency. Automation at the table level does not require capital-intensive infrastructure. It requires a structured digital menu, NFC hardware that delivers it instantly, and a menu engineering process that positions high-margin items correctly within that flow. The data across all four case studies shows that these three components, implemented correctly, produce consistent and trackable revenue improvement without requiring operational restructuring.
Practical Application: Implementing NFC Smart Menu Coasters
Step 1: Deploy NFC Coasters at Tables
NFC coasters are placed on each table surface. No app installation is required from the customer. A tap on any NFC-enabled smartphone — iPhone or Android — opens the digital menu directly in the device's browser. Installation requires no POS integration for menu access. Each coaster is linked to the operator's SmartMenuCoasters account, where the digital menu is managed and updated in real time.
Step 2: Structure the Digital Menu for High AOV
The menu must be engineered for decision flow, not just item listing. This means: place high-margin items in the first scroll position within each category; sequence add-ons and pairings immediately below the parent item; use visual hierarchy — images, labels, and pricing proximity — to surface upgrades without requiring the customer to search for them. A flat menu that mirrors a printed card will not produce upsell rate improvement. The structure of the digital menu is what drives add-on selection.
Step 3: Set Upsell Prompts by Item and Category
Within the SmartMenuCoasters menu builder, upsell and pairing prompts are assigned at the item level. When a customer selects a main course, the system displays a pairing prompt — typically a complementary beverage or starter. When a customer is in the dessert section, the system surfaces coffee add-ons. These prompts are not popups or interruptions; they are embedded in the ordering flow. The customer encounters them at the moment of decision, which is when conversion rates are highest.
Step 4: Track Key Metrics and Optimize
The following metrics should be tracked weekly from the SmartMenuCoasters dashboard and compared against pre-implementation baselines:
Average Ticket Size (AOV): Track per service period and per day of week. Identify shifts where AOV underperforms and correlate with menu structure or item placement.
Tap-to-Menu Interaction Rate: Measures what percentage of seated covers tap the coaster. A rate below 60% indicates placement, signage, or awareness issues at the table.
Upsell Rate: Percentage of orders that include at least one add-on, pairing, or premium upgrade. Target rate for full-service operations is 35% or higher after 60 days.
Table Turnover Rate: Covers per table per service period. Compare against pre-implementation to confirm ordering speed improvement.
Revenue Per Table Per Hour: The primary efficiency metric combining AOV and turnover. This figure should increase in every deployment.
Step 5: Update the Menu on a Rolling Basis
Static digital menus lose upsell effectiveness over 30 to 60 days as regular customers stop engaging with unchanged content. Menus should be reviewed and updated monthly. Item placement should be adjusted based on upsell rate data. Low-margin items that appear in high-visibility positions should be replaced or repositioned. Seasonal add-ons and limited-run items should be introduced with visual emphasis to drive engagement from repeat customers.
Common Implementation Mistakes
1. Deploying NFC Menus Without Restructuring Item Sequencing
Converting a printed menu to a digital format without changing its structure produces minimal revenue impact. The print-format sequence — typically appetizers, mains, desserts, drinks — does not optimize for digital decision flow. Operators who deploy a digitized version of their existing menu and expect automatic AOV improvement will not see it. Menu engineering for the digital format is a required step, not an optional one.
2. Ignoring Tap Interaction Data
The tap-to-menu interaction rate is the most immediate indicator of system engagement. If the rate is below 55%, the NFC coasters are not being used by the majority of covers. This is almost always a placement or awareness issue — coasters positioned on the edge of the table, not near the customer's primary sightline, or without a visible call-to-action prompt on the coaster surface. Operators who do not monitor this metric will attribute underperformance to the system rather than to a correctable deployment issue.
3. Not Optimizing for Mobile Menu Flow
Digital menus accessed on mobile devices follow different reading patterns than print menus. Items placed at the bottom of long category lists are rarely viewed. Menus with more than 7 to 8 items per category produce decision fatigue that reduces add-on selection rates. A mobile-optimized menu limits category depth, uses images selectively for high-margin items, and surfaces upsell prompts within two taps of any main item selection.
4. Underutilizing NFC Interaction Data
Every tap generates data: which items are viewed most frequently, which add-ons are accepted or bypassed, which menu sections receive the least engagement. Operators who review this data monthly can identify underperforming sections, reposition high-margin items, and remove items that generate menu clutter without contributing to revenue. Ignoring this data is equivalent to ignoring weekly sales reports.
5. Relying on Staff for Upselling After NFC Deployment
NFC menus do not eliminate the server role, but they do change it. Post-deployment, servers should focus on order confirmation, beverage pacing, and experience quality — not on menu delivery or first-order upselling, which the system handles. Operators who maintain the expectation that staff will verbally upsell in addition to NFC-prompted upsells create message duplication that customers find intrusive. The system and the staff should operate in distinct lanes.
Conclusion
The operating logic is straightforward. Faster menu access produces faster ordering decisions. Faster ordering decisions produce faster table cycling. Faster table cycling, combined with a structured upsell flow that increases AOV, produces higher revenue per table without increasing seat count or labor. Each of these outcomes is traceable to a single system change: replacing the manual menu access process with NFC-enabled, instant digital access at every table.
The four operator cases in this article demonstrate the same pattern across different restaurant types and volume levels. A casual dining operation, a bar and grill, a neighborhood cafe, and a quick service restaurant all recorded measurable improvements in AOV, table turnover rate, and monthly revenue within 90 days of NFC coaster deployment. The common variable was not the restaurant type — it was the elimination of ordering friction at the table level.
Restaurant automation tools for small businesses operate most effectively when they remove a specific, measurable bottleneck in the revenue process. In table service, that bottleneck is the gap between seating and ordering. SmartMenuCoasters closes that gap consistently, at every table, on every shift, regardless of staff performance on any given day. That consistency is the operational value of the system.
Explore SmartMenuCoasters for Your Operation
If your restaurant is experiencing slow table turnover, inconsistent upsell performance, or ordering friction during peak service, NFC smart menu coasters address these problems at the table level. SmartMenuCoasters installs in your existing table layout, works with any smartphone, and requires no POS replacement for menu access and upsell functions.
The system is designed for operators who need measurable improvement in AOV, table turnover rate, and revenue per table — tracked from the first week of deployment. Visit SmartMenuCoasters.com to review the implementation process and request a deployment consultation for your specific operation.
FAQ
What are restaurant automation tools for small businesses and how do NFC menus qualify?
Restaurant automation tools for small businesses are systems that replace manual, variable processes with consistent, technology-driven actions that directly affect revenue or efficiency. NFC smart menu coasters qualify because they automate menu access and upsell prompting — two processes that previously depended entirely on staff timing and verbal communication. The system delivers a consistent customer experience at every table on every shift without requiring staff to initiate the process.
How much does average ticket size typically increase after deploying NFC smart menu coasters?
Based on operator data from SmartMenuCoasters deployments, average ticket size increases range from 18% to 33% within the first 90 days. The variation is driven primarily by how well the digital menu is structured for upsell flow. Operations that invest in menu engineering alongside NFC deployment see the higher end of that range. The increase comes from higher add-on selection rates and more frequent pairing purchases, both prompted within the digital menu.
Will NFC menu coasters affect table turnover rate if customers spend time on their phones?
The data across all four operator cases shows a reduction in average visit duration of 13 to 22 minutes following NFC coaster deployment. Customers who access the menu immediately after seating make ordering decisions faster because they are not waiting for staff to deliver a physical menu or return for the order. The reduction in wait time at the front of the visit more than offsets any additional time customers spend browsing the digital menu.
Do NFC coasters work with my existing POS system?
For menu access and upsell prompting functions, NFC coasters operate independently of the POS system. The customer taps to view the menu and may submit order preferences digitally, which the server then processes through the existing POS. Full POS integration is available for operations that want to route digital orders directly to the kitchen, but it is not required for the core menu access and upsell functions that drive the primary revenue improvements.
What is a realistic tap-to-menu interaction rate and how do I improve it?
Interaction rates in active SmartMenuCoasters deployments range from 68% to 84% of seated covers. The primary factors affecting rate are coaster placement — centered in the customer's primary table sightline — and the presence of a clear call-to-action on the coaster surface. Operations with rates below 60% typically resolve the gap by repositioning coasters and adding table signage directing customers to tap for the menu. Monitoring this metric weekly during the first 30 days of deployment identifies placement issues before they suppress overall system performance.