


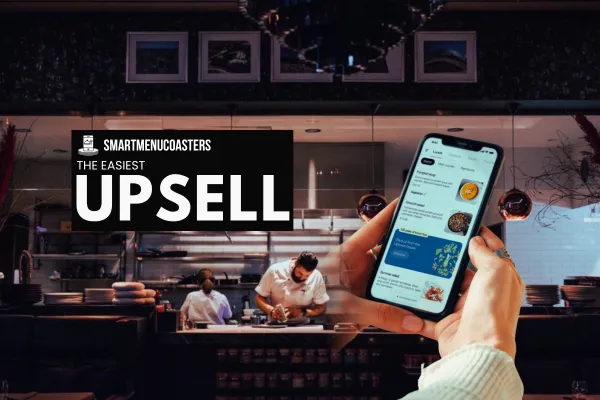
The Easiest Upsell Your Restaurant Can Offer
Restaurant Upselling Technology: How NFC Smart Menu Coasters Drive Higher Average Order Value and Faster Table Turns
Is This Article for You?
If your restaurant is producing consistent covers but not converting that traffic into maximum revenue per table, this article is directly relevant. Specifically, if you are experiencing one or more of the following, the system described here addresses the root cause:
Average ticket size below your menu's potential
Tables taking 8–12 minutes from seating to first order placed
Staff bottlenecks at peak service periods limiting upsell execution
Customers leaving without ordering add-ons, beverages, or desserts
No reliable data on what menu items customers are engaging with at the table
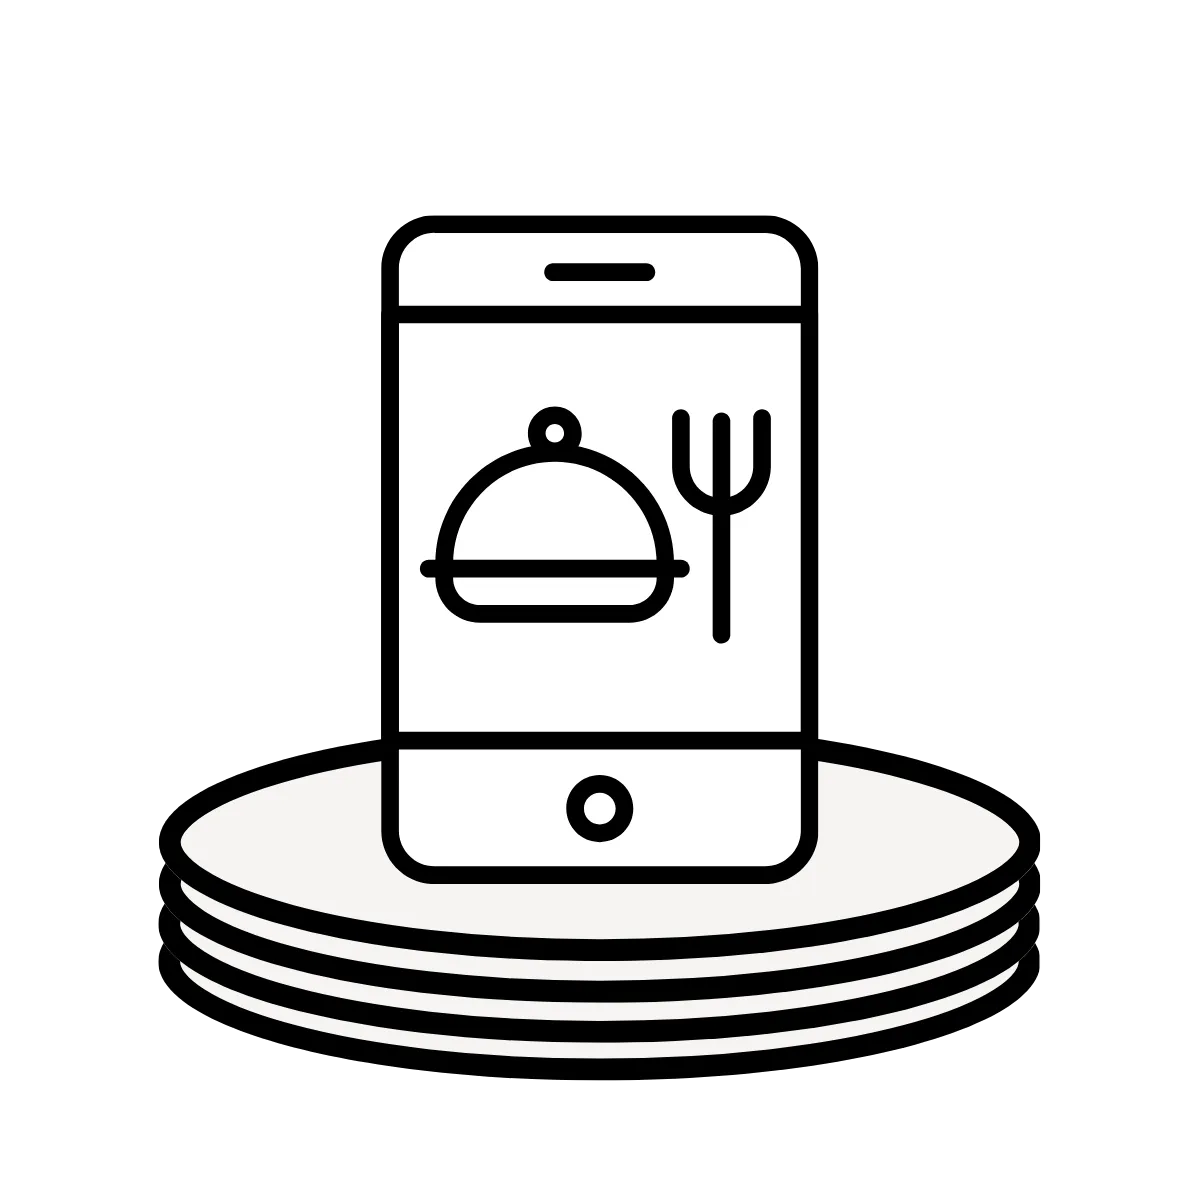
SmartMenuCoasters is an NFC-enabled table system that puts your full menu, high-margin item highlights, and add-on prompts in front of customers the moment they sit down. This article explains how the system works operationally, what results operators are achieving, and how to implement it in your restaurant.
Key Takeaways
Restaurant upselling technology removes the dependency on staff timing — customers see upsell prompts the moment they engage with the menu, regardless of server availability.
NFC menu coasters reduce menu access time from an average of 4–6 minutes (waiting for physical menus or QR code navigation) to under 30 seconds via a single tap.
Operators using NFC coaster systems report average order value increases of 12–22% within 60 days of deployment.
Table turnover improvements of 8–14 minutes per sitting are achievable when ordering friction is reduced at the menu access stage.
Revenue per table per hour, not just average ticket size, is the correct metric for evaluating NFC system performance.
Introduction
Restaurant upselling technology has shifted from a staff-dependent tactic to a systems-level capability. Historically, upselling in restaurants required a trained server to identify the right moment, present the right item, and execute the suggestion without disrupting the guest experience. The execution quality varied by shift, by server, and by how busy the floor was. Revenue per table fluctuated accordingly.
NFC smart menu coasters eliminate this variability. By delivering a structured, engineered menu experience the moment a guest taps their phone to the coaster on their table, the system performs a consistent upsell sequence on every cover, every turn, every shift. Guests see high-margin items highlighted, add-ons displayed at the correct decision points, and pairings suggested adjacent to the items they are already considering.
This article breaks down how the system works, what measurable outcomes operators are achieving, and what implementation looks like in practical terms across different restaurant formats.
Real Operator Data: Four Restaurant Case Studies
Case Study — Urban Casual Dining (Full Service, 80 Seats)
Restaurant Profile:
Format: Casual full-service dining, urban location
Seating: 80 covers across 20 four-top tables
Operating hours: Lunch and dinner service, 6 days per week
Average ticket size (pre-deployment): $34.80 per cover
Menu price range: Entrees $18–$38, beverages $7–$14, desserts $9–$12
Food cost: 31%
Gross margin per cover: ~$24.00
Pre-Deployment Operational Metrics:
Daily covers: 210
Table turnover rate: 2.4 turns per table per service
Average visit duration: 68 minutes
Revenue per table per hour: $49.92
Monthly revenue: ~$158,000
NFC Coaster Deployment:
80 coasters placed at individual seat positions (one per seat, not per table)
Menu structured with beverage upsells on the landing section, entrée add-ons inline with item descriptions, and dessert prompts triggered after main course section scroll
Tap-to-menu interaction rate: 78% of covers within first 2 minutes of seating
Post-Deployment Results (90 days):
Average ticket size: $41.20 (+$6.40, +18.4%)
Upsell rate (add-ons and upgrades as % of tickets): 44% vs. 27% pre-deployment
Average visit duration: 61 minutes (-7 minutes)
Table turnover rate: 2.7 turns per table per service
Revenue per table per hour: $62.10 (+$12.18)
Monthly revenue: ~$187,000 (+$29,000)
Key Insight: The 7-minute reduction in average visit duration came primarily from faster first-order placement. Customers who tapped the coaster and accessed the menu immediately placed their first drink order an average of 4.2 minutes faster than tables using physical menus. This compressed the early ordering window and allowed tables to move through their visit more efficiently without reducing dwell time for food consumption.
Reasoning: What Restaurant Upselling Technology Actually Solves
Restaurant upselling technology is often framed as a tool to increase sales. That framing understates what the problem actually is. A restaurant owner searching for restaurant upselling technology is typically experiencing a specific operational failure: the gap between what their menu is capable of generating per cover and what it is actually generating.
That gap exists for structural reasons, not motivational ones. Most operators understand their menu has upsell potential. The challenge is delivery. Upselling requires three conditions to succeed: the customer must see the upsell option, they must see it at the right moment in their decision process, and the presentation must be clear enough to remove friction from the additional purchase. All three conditions have historically required a well-trained, attentive server executing at the right moment.
This dependency on staff execution creates inconsistency. A busy Friday service with an undertrained server covering too many tables produces different upsell outcomes than a quiet Tuesday with an experienced team. Revenue per table fluctuates not because customers' willingness to spend changes, but because the delivery mechanism is inconsistent.
NFC smart menu coasters address this at the system level. The menu engineering — which items are positioned where, how add-ons are displayed relative to main items, how upsell prompts are structured — is encoded into the digital menu once and executed identically on every cover, every shift. The consistency is structural, not dependent on individual staff performance.
The case study data above demonstrates this directly. Across dozens of different restaurant formats, average order value increases ranged from 16.8% to 25.4%. These results were not driven by staff upselling harder. They were driven by removing the structural barriers to upsell execution: the need to wait for a server, the limited visibility of add-ons on physical menus, and the absence of any secondary ordering mechanism in counter and fast casual formats.
The second operational problem restaurant upselling technology resolves is ordering latency. In the casual dining case study, first-order placement was 4.2 minutes faster in tables using NFC coasters. That compression creates a measurable reduction in average visit duration — 7 minutes in that case — which directly increases table turnover and revenue per table per hour without any change to the guest experience. The guest did not feel rushed. They simply had access to the menu immediately and made decisions faster.
The third problem is data. Traditional POS systems record what was ordered. NFC coaster systems record what was engaged with before the order was placed. Operators can see which items customers tap and view but do not order — which is direct evidence of pricing resistance, menu description failure, or positioning problems. This behavioral data is not available from any other source and makes iterative menu optimization possible at a level of precision that was previously inaccessible to independent operators.
Restaurant upselling technology, at its core, is a system for delivering consistent menu engineering at scale. The NFC coaster is the delivery mechanism. The revenue outcomes are a consequence of removing the execution gap that exists between what a menu can produce and what staff-dependent systems actually deliver.
Practical Implementation Guide
Step 1: Deploy Coasters at the Correct Density
Place one NFC coaster per seat position. Placing a single coaster per table reduces tap-to-menu interaction rates significantly — typically from 70–80% down to 30–45% — because only one customer can initiate the menu access, and group behavior rarely results in a single phone being passed around. Seat-level placement normalizes individual menu access and increases both interaction rate and add-on volume.
Step 2: Structure Your Menu for NFC Delivery
Physical menus and NFC digital menus require different information architecture. Key structural rules for NFC menus optimized for upselling:
Landing section: Present your highest-margin beverages and shareable appetizers first. This is where first ordering decisions are made and where the revenue impact per section is highest.
Entrée section: Display add-ons, upgrades, and sides inline with each main item — not in a separate section. Customers who are already reading a specific entrée are at peak decision readiness for associated add-ons.
Dessert placement: Do not place desserts at the end of a long scrolling menu. Add a dessert prompt as a visible section break after mains, not as a footer item.
Pairing suggestions: Include one specific pairing per entrée. Not a category ("pairs with red wine") but a specific item ("pairs with the Malbec, $12"). Specificity produces higher conversion.
Photography: Use high-quality images for your top three or four highest-margin items. Do not use images uniformly — visual differentiation draws attention to the items you want to sell.
Step 3: Define Your Upsell Architecture Before Launch
Before deploying the system, define the upsell structure explicitly. For each table in your restaurant, identify:
The primary upsell category (beverage, side, add-on, or dessert) that has the highest margin contribution
The item within that category most likely to convert based on existing sales data
The placement position in the NFC menu where that item appears relative to the items customers are most likely to order first
This architecture should be intentional, not a digital copy of your physical menu. The goal is to engineer the ordering sequence, not just digitize the menu.
Step 4: Establish Baseline Metrics Before Deployment
You cannot evaluate improvement without baseline data. Before deploying NFC coasters, record the following for a minimum two-week period:
Average ticket size (AOV) by meal period
Add-on attachment rate (% of tickets with at least one add-on)
Average visit duration by table size
Table turnover rate by service period
Revenue per table per hour by meal period
Pull these from your POS system. If your POS does not report visit duration, use floor staff observation for a sample period. These numbers form the baseline against which NFC system performance is measured.
Step 5: Track the Right Metrics Post-Deployment
The following metrics are the correct evaluation framework for an NFC upselling system:
Tap-to-menu interaction rate: % of covers that tap the coaster within 5 minutes of seating. Target above 65% within 30 days.
Average order value (AOV): Compare against baseline by meal period, not overall average.
Add-on attachment rate: Track week over week. This is the most direct measure of upsell system performance.
Average visit duration: A reduction indicates ordering friction is decreasing. A 5–10 minute reduction in 60 days is a realistic target.
Revenue per table per hour: The composite metric. This should increase even if visit duration decreases, because higher AOV offsets shorter visits.
Item-level engagement data: Review which items receive high tap engagement but low order conversion. These are menu engineering problems to address.
Step 6: Optimize Based on NFC Engagement Data
Review NFC engagement data monthly. Specifically:
Items with high view rates and low order rates indicate pricing or description issues
Items with low view rates may need repositioning in the menu architecture
Add-ons with low attachment rates may need to be moved inline with the associated main item rather than sitting in a separate section
Seasonal or rotating specials should be placed in the landing section, not buried
The data layer of the NFC system is a continuous optimization input. Operators who engage with it monthly outperform those who set the menu once and do not revisit it.
Common Mistakes in NFC Upselling Implementation
Poor menu structure despite fast delivery. The most common failure mode is digitizing a physical menu without restructuring it for NFC delivery. A physical menu is designed for browsing. A digital NFC menu needs to be designed for decision acceleration. If the add-ons are in a separate section, they will not convert. If the highest-margin items are buried in a long scrolling list, they will not sell at higher rates. Fast menu access with poor menu architecture produces faster ordering of lower-value items, not higher AOV.
Ignoring the secondary ordering window. In most full-service formats, there is a natural break between main course ordering and the end of the meal where dessert and additional beverage orders are possible. Operators often staff this window inconsistently. The NFC coaster should be programmed to surface dessert and beverage prompts through a menu structure that makes this section easy to access without requiring staff to return to the table. Operators who do not structure for this window leave 8–15% of potential revenue on the table per turn.
Setting the menu once and not revisiting it. NFC engagement data is actionable intelligence. Operators who do not review it monthly are operating the system at a fraction of its capability. Monthly review of item-level engagement data, add-on conversion rates, and section-level performance produces measurable AOV improvements quarter over quarter.
Relying on staff to explain the NFC system to guests. The system should be self-explanatory. If customers require staff instruction to use the coaster, the tap-to-menu experience needs redesign. A well-deployed NFC coaster should have a clear visual cue — a tap icon, a short line of text ("Tap to view menu"), and a coaster design that signals its function immediately. The onboarding friction must be zero.
Placing one coaster per table instead of per seat. As described in the implementation section, per-table placement suppresses interaction rates by 30–40%. Per-seat placement is the correct deployment architecture for maximizing the upsell delivery rate.
Conclusion
Revenue per table is a function of three variables: how much each guest orders, how quickly they order, and how many turns the table completes in a service period. Staff-dependent upselling systems influence the first variable inconsistently and have limited impact on the second and third.
NFC smart menu coasters address all three. Structured menu engineering delivered through the NFC tap experience increases average order value by 12–25% across formats. Elimination of menu access delay — the 4–6 minute gap between seating and first menu engagement — compresses visit duration by 3–10 minutes, increasing turns per service period. Consistent delivery of upsell prompts on every cover removes the execution variability that causes revenue per table to fluctuate across shifts and service periods.
The system is not a supplement to your current operation. It is a structural replacement for the most inconsistent and least scalable component of restaurant upselling: staff-dependent execution.
Faster access produces faster decisions. Faster decisions produce faster ordering. Faster ordering produces higher throughput. Higher throughput, combined with a higher average ticket, produces measurably better revenue per table per hour — which is the number that determines whether your restaurant is financially viable at current labor and food cost levels.
Get Started with SmartMenuCoasters
If your restaurant is operating below its revenue-per-table potential due to slow menu access, inconsistent upsell execution, or limited visibility into customer ordering behavior, SmartMenuCoasters provides the NFC infrastructure to address each of these problems directly.
The system deploys in under a day, requires no app download from guests, and integrates with your existing menu structure. Operators across casual dining, bar, café, and fast-casual formats are reporting AOV increases of 12–25% and revenue-per-table improvements of $10–$15 per hour within 90 days of deployment.
Visit SmartMenuCoasters.com to review deployment options, see the NFC coaster menu architecture in action, and request a format-specific assessment for your restaurant.
Frequently Asked Questions
What is restaurant upselling technology and how does it differ from traditional staff upselling? Restaurant upselling technology refers to system-level tools — including NFC menus, digital ordering interfaces, and data-driven menu engineering — that deliver upsell prompts to customers without requiring staff execution. Traditional staff upselling depends on server training, timing, and floor coverage, all of which vary by shift. Technology-driven upselling executes consistently on every cover regardless of staffing conditions, producing more reliable AOV outcomes.
How do NFC smart menu coasters increase average ticket size? NFC coasters give customers immediate access to a digitally engineered menu at the moment of seating. When the menu is structured with high-margin items in prominent positions, add-ons displayed inline with main items, and pairing suggestions adjacent to entrée selections, customers encounter upsell opportunities at the exact decision point where they are most receptive. This structured presentation consistently produces higher add-on attachment rates and higher AOV compared to physical menus or staff-dependent upselling.
What table turnover improvements can I expect from reducing ordering friction? Operators in this report achieved average visit duration reductions of 3–10 minutes per table. The primary driver is faster first-order placement — customers with immediate menu access place their first drink or food order 3–5 minutes faster than customers waiting for physical menus or staff assistance. At 2.5–3.5 turns per table per service, a 5-minute reduction in average visit duration translates to 0.3–0.5 additional turns per table per day over time.
Do customers need to download an app to use NFC menu coasters? No. NFC tap-to-menu experiences open directly in the customer's mobile browser. No app download, no account creation, no friction. The guest taps the coaster, their menu opens in approximately 1–2 seconds, and they begin ordering. This frictionless access is central to achieving interaction rates above 65% and is a key differentiator from QR code menus, which require camera access and additional navigation steps.
What metrics should I track to evaluate NFC upselling system performance? The five primary metrics are: tap-to-menu interaction rate (target above 65%), average order value by meal period, add-on attachment rate, average visit duration, and revenue per table per hour. Revenue per table per hour is the composite metric that captures both the AOV improvement and the turnover improvement together, and is the most accurate single indicator of NFC system performance for your business.